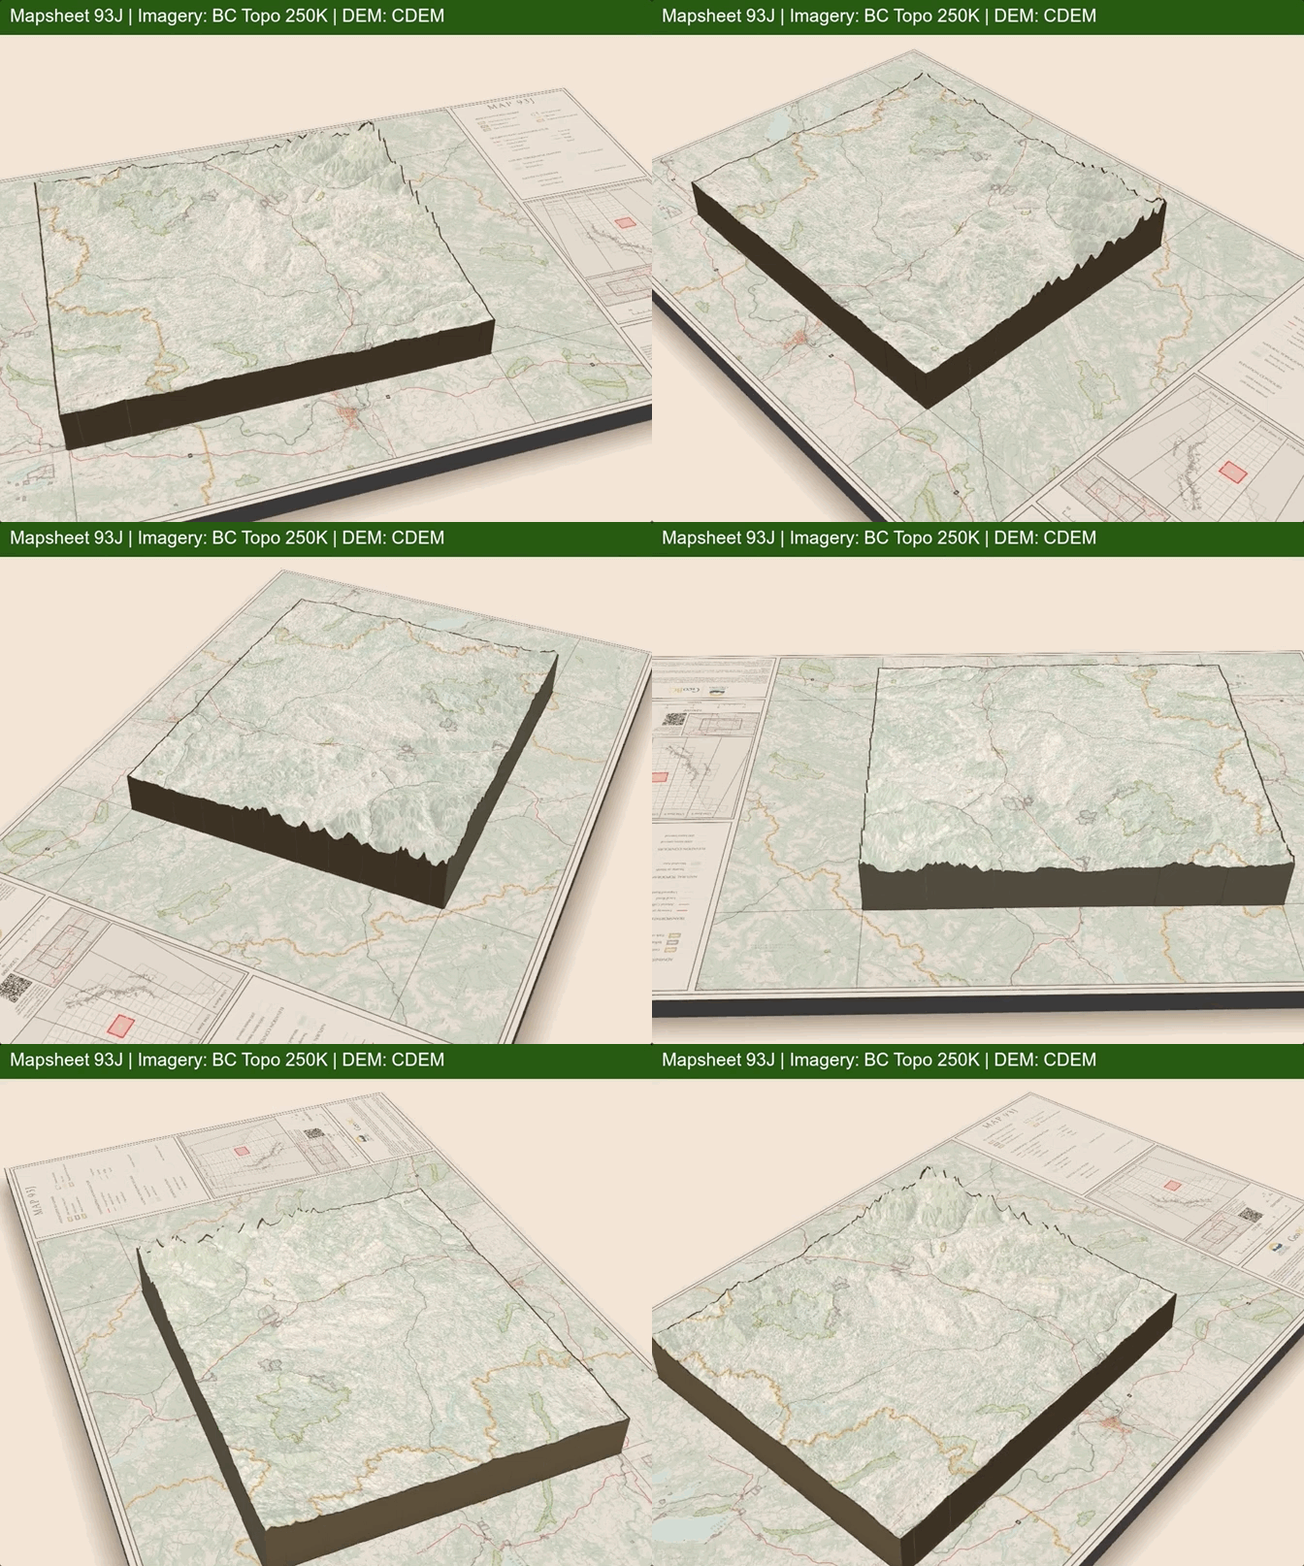
BC Topo Frankenmap
Mon 18 October 2021Rayshader is a really amazing R module for creating 2D and 3D visualizations. As a Python developer, I've been jealous and curious about these visuals, so I set about using it, in the way I think God intended - a Python Jupyter notebook.
Even though I want to use Python for the bulk of the workflow, rayshader is an R module, regardless how I want to use it, which means I need to interact with rayshader through R. We can do that from within a Python Jupyter notebook environment using rpy2.
It's pretty easy, once everything is installed successfully. Load the extension with:
%load_ext rpy2.ipython
Then, switch any cell to R using the %%R magic (optionally, pass variables from Python using the -i flag):
%%R
R.version.string
Now, to an example. The idea here is that I want an animation in which we show a BC 250K mapsheet, in which the mapsheet area itself is shown as raised elevation.

Data sources:
- NTS 250K mapsheet: BC Maps & Orthos
- CDEM elevation: FTP
You can find the notebook here.
Get in touch with me on Twitter if you want to continue the discussion!
 Darren Wiens